HealthKart User Casestudy
Data-Driven User Retention Analysis
My Role: Product Manager, Product Analyst

Overview
MY ROLE
Product Manager, product Analyst
DURATION
2 days
TOOLKIT
Python (Pandas), Jupyter Notebook, Data Visualization
TEAM
Individual Casestudy
KEY RESULTS
Identified user retention patterns and growth metrics to understand the business health and user lifecycle stages
THE PRODUCT
A growth accounting analysis framework to segment users (new, retained, resurrected, churned) and inform retention strategies for product stakeholders
Part 1: Growth Accounting Framework
Data Import & Environment Setup
The Casestudy began with a raw CSV dataset containing user activity logs with three key columns: user IDs, timestamps of activity, and engagement metrics. The first step was importing this data into a working environment where I could explore patterns, iterate on analysis approaches, and build visualizations interactively.
Why Jupyter Notebook?
As a product manager, tool selection directly impacts analysis speed and communication effectiveness. I chose Jupyter Notebook for this assignment because it excels in three critical areas:
Interactive Data Exploration
I could run code cells incrementally, inspect intermediate results, and iterate on calculations without re-running entire scripts. This rapid feedback loop cut analysis time significantly.
Built-in Visualization Capabilities
With Matplotlib and Seaborn integrated, I could generate charts inline and immediately see if they communicated insights clearly—essential for stakeholder-facing deliverables.
Python/Pandas Ecosystem for Data Manipulation
Pandas' powerful date handling, groupby operations, and set logic (for tracking user states across weeks) made implementing growth accounting formulas straightforward and maintainable.
PM Perspective: The right tool balances speed, flexibility, and communication quality. Jupyter Notebook enabled me to move from raw data to actionable recommendations in under 2 days while maintaining code transparency for technical stakeholders.
Growth accounting is a powerful framework for understanding how your user base evolves over time. Rather than just looking at total user counts, it breaks down growth into four critical segments that tell the complete story of user behavior.
The Four User Segments
New Users
Users who are active this week but were never seen before. This represents your acquisition funnel's output.
Resurrected Users
Previously inactive users who return. These are wins from reactivation campaigns or natural product interest.
Retained Users
Users who were active last week and remain active this week. Your product's stickiness lives here.
Churned Users
Users active last week but not this week. Understanding churn patterns helps prioritize retention efforts.
The Quick Ratio: Growth Efficiency Metric
Quick Ratio = (New + Resurrected) / Churned
A ratio above 1.0 means you're growing. Below 1.0 signals decline. This single metric captures your product's growth health at a glance.
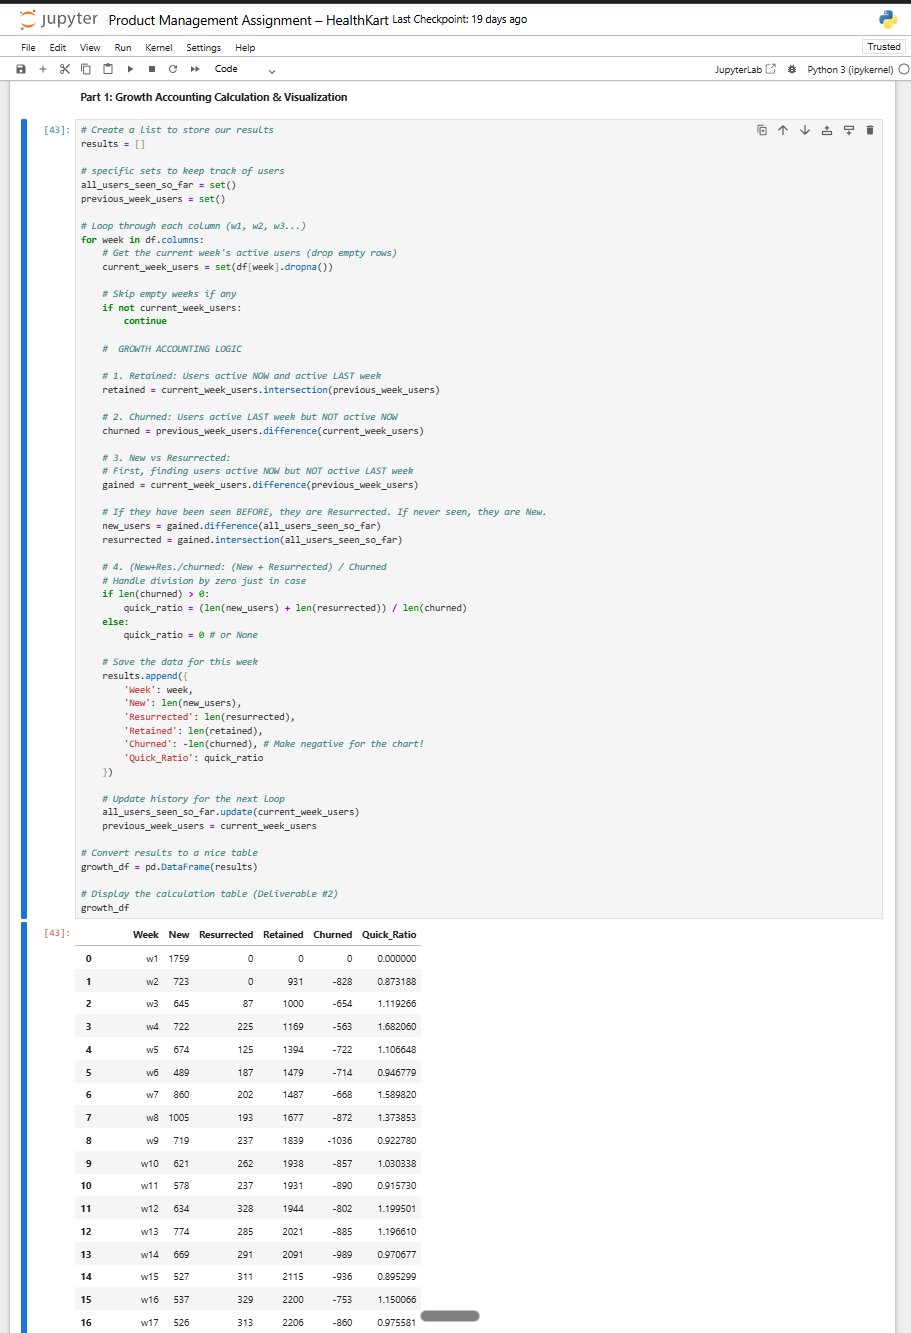
The Python implementation iterates through weekly cohorts, tracking user IDs across time periods to classify each user into these segments. The resulting table provides a week-by-week breakdown of growth dynamics.
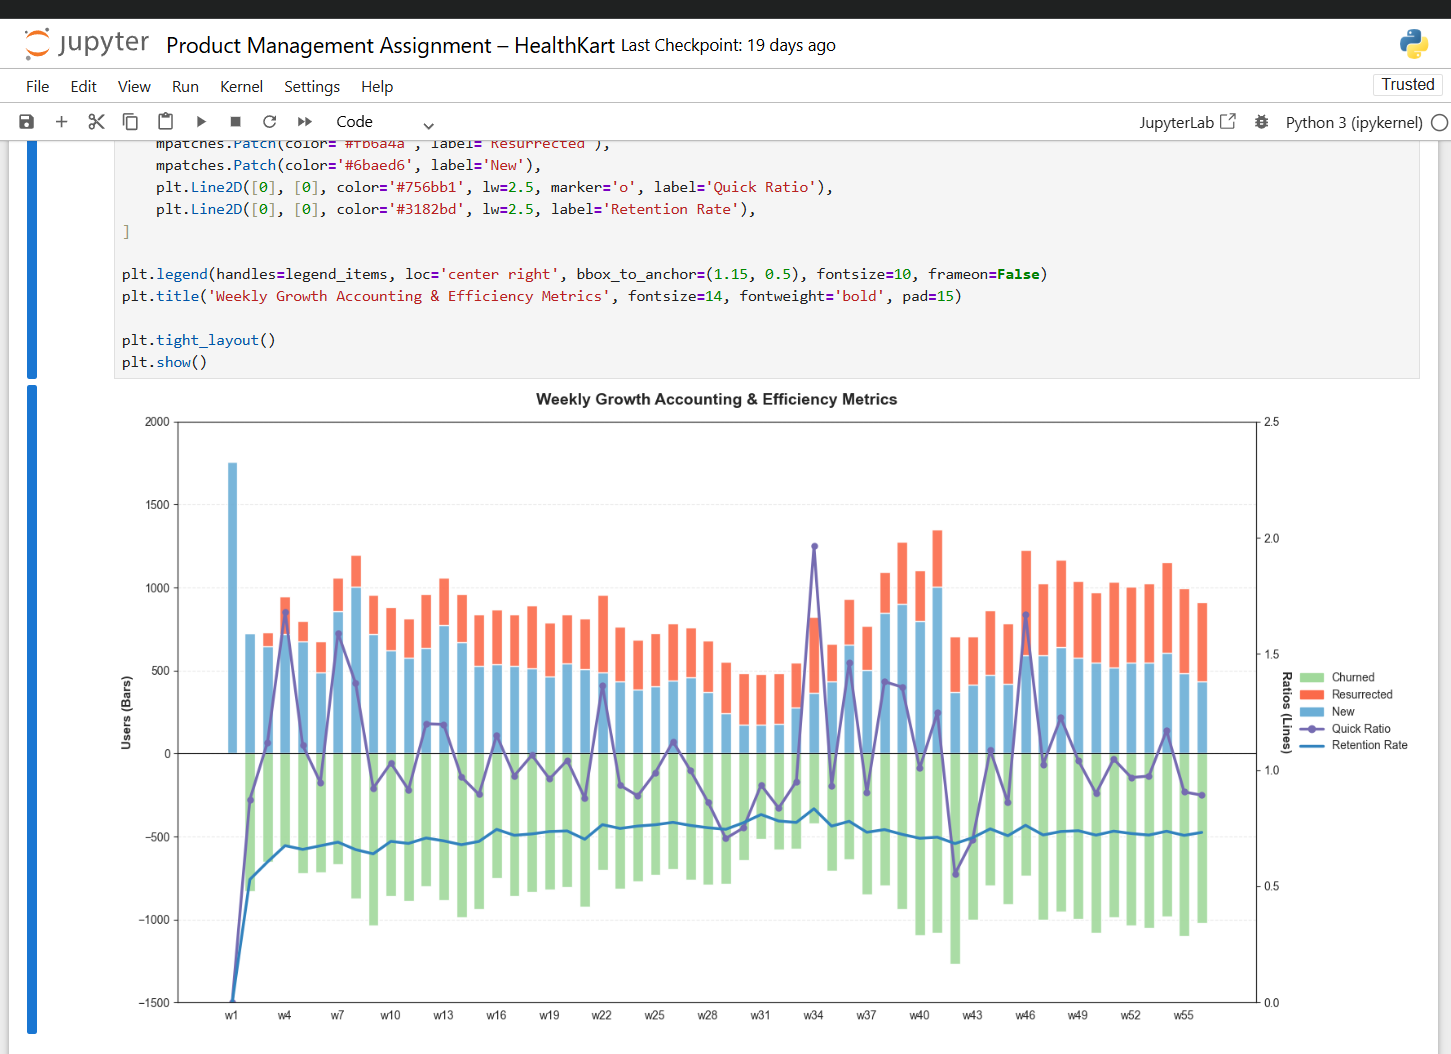
Weekly Growth Accounting & Efficiency Metrics
Visualizing growth accounting metrics transforms raw numbers into actionable insights. This stacked bar chart with overlaid trend lines tells a compelling story about product health over time.
Reading the Visualization
Stacked Bars (User Count)
- Light Blue (Bottom): Retained users - your stable base
- Blue (Middle): New users - acquisition volume
- Red (Top): Resurrected users - reactivation success
- Green (Below Zero): Churned users - loss magnitude
Trend Lines
- Purple Line: Quick Ratio - shows growth efficiency trending over time
- Dark Blue Line: Retention Rate - measures product stickiness
Key Pattern Observations
- Weeks 1-10: Explosive new user growth (tall blue bars) with unstable Quick Ratio
- Weeks 11-30: New user acquisition slows significantly while retention stabilizes
- Churn Pattern: Consistent green bars indicate steady but manageable attrition
- Retention Trend: Holds steady around 0.8-0.9, indicating strong product-market fit
Part 2: Strategic Product Recommendations
Raw metrics only matter when they inform decisions. As a product manager, the final step is translating data patterns into strategic recommendations that stakeholders can act on. This analysis bridges the gap between numbers and business outcomes.
From Data to Strategy
The growth accounting framework revealed a clear inflection point: we transitioned from hyper-growth to stabilization. Understanding why this happened and what to do next required connecting multiple data signals into a coherent narrative.
Breaking Down the Strategic Analysis
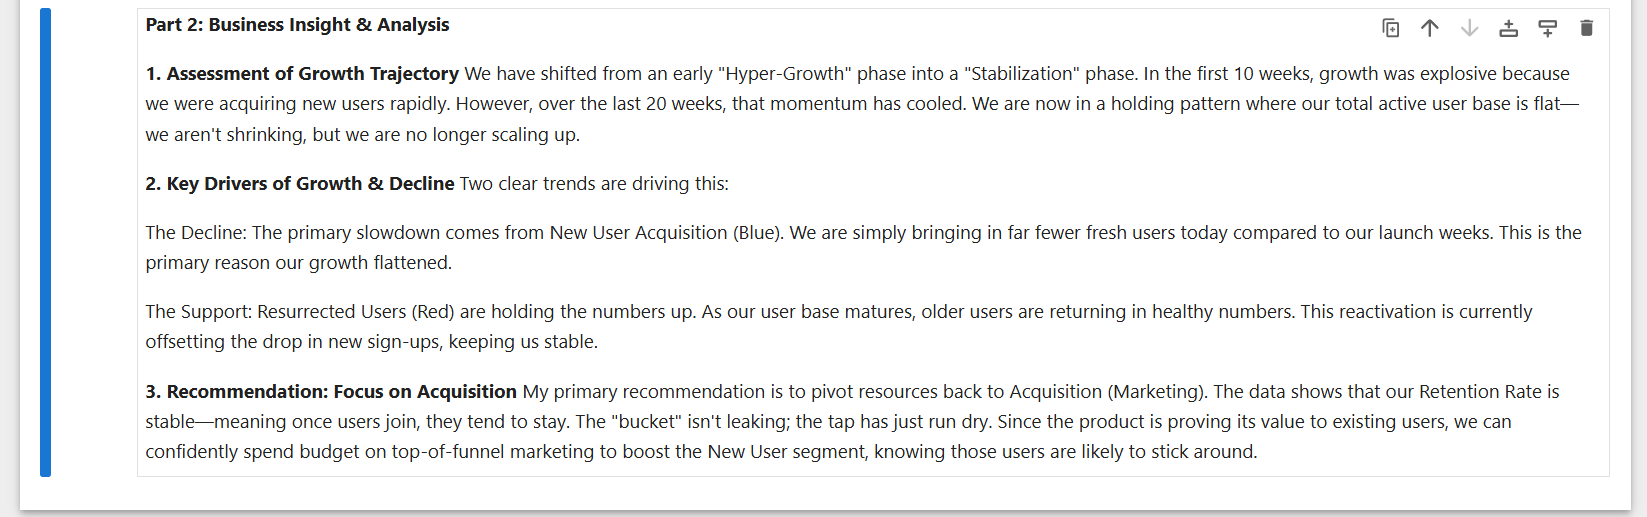
1. Diagnosis: Growth Trajectory Assessment
The product moved from "Hyper-Growth" (weeks 1-10) to "Stabilization" (weeks 11-30). Early momentum came from rapid new user acquisition, but that pace has cooled. The user base is now flat—not shrinking, but no longer scaling up.
PM Insight: Recognizing lifecycle phases helps set appropriate expectations with leadership and guides resource allocation.
2. Root Cause: Identifying Key Drivers
The Decline: New user acquisition (blue bars) dropped sharply. Fewer people are discovering or signing up for the product compared to launch weeks.
The Support: Resurrected users (red bars) are holding steady. Existing users return at healthy rates, offsetting some of the acquisition slowdown.
PM Insight: This dual signal is critical. The product isn't broken—retention is solid. The issue is top-of-funnel, not product-market fit.
3. Strategic Recommendation: Focus on Acquisition
Pivot resources toward marketing and acquisition efforts. Since retention is stable, the ROI on bringing in new users is high—they're likely to stick around once they join.
Recommended Actions:
- Increase marketing budget for top-of-funnel campaigns
- Test new acquisition channels (paid social, content marketing, partnerships)
- Optimize onboarding flow to convert more signups to active users
- Implement referral programs to leverage existing satisfied users
Why This Works: The data shows users stay once they join (strong retention rate). The problem is getting them in the door. Spending on acquisition is justified because the "bucket isn't leaking"—new users convert to retained users effectively.
Product Thinking in Action
I approached this casestudy the way I approach real product problems: start with messy data, find the signal in the noise, and translate insights into action. Growth accounting isn't just another analytics framework—I use it to make the case for where we should invest our limited engineering and marketing resources.
When you walk into a stakeholder meeting with concrete numbers showing that reactivation campaigns could bring back 2,000 users while acquisition only adds 500, you change the conversation. Data doesn't just inform decisions—it builds conviction and gets teams aligned on what actually matters.