IPL Data Product Case Study
Using Data to Drive Product Strategy
My Role: Product Manager, Data Analyst
Overview
MY ROLE
Product Manager, Data Analyst
DURATION
2 weeks
TOOLKIT
Python (Pandas), SQL, Jupyter Notebook, Plotly
TEAM
Individual project
KEY RESULTS
Identified actionable insights for team strategy and player performance optimization
THE PRODUCT
An internal insights dashboard for strategic stakeholders (e.g., team owners, fantasy league managers, broadcasters)
The 'Why': The Product Problem
"As a PM, my first step is to identify the user and the problem."
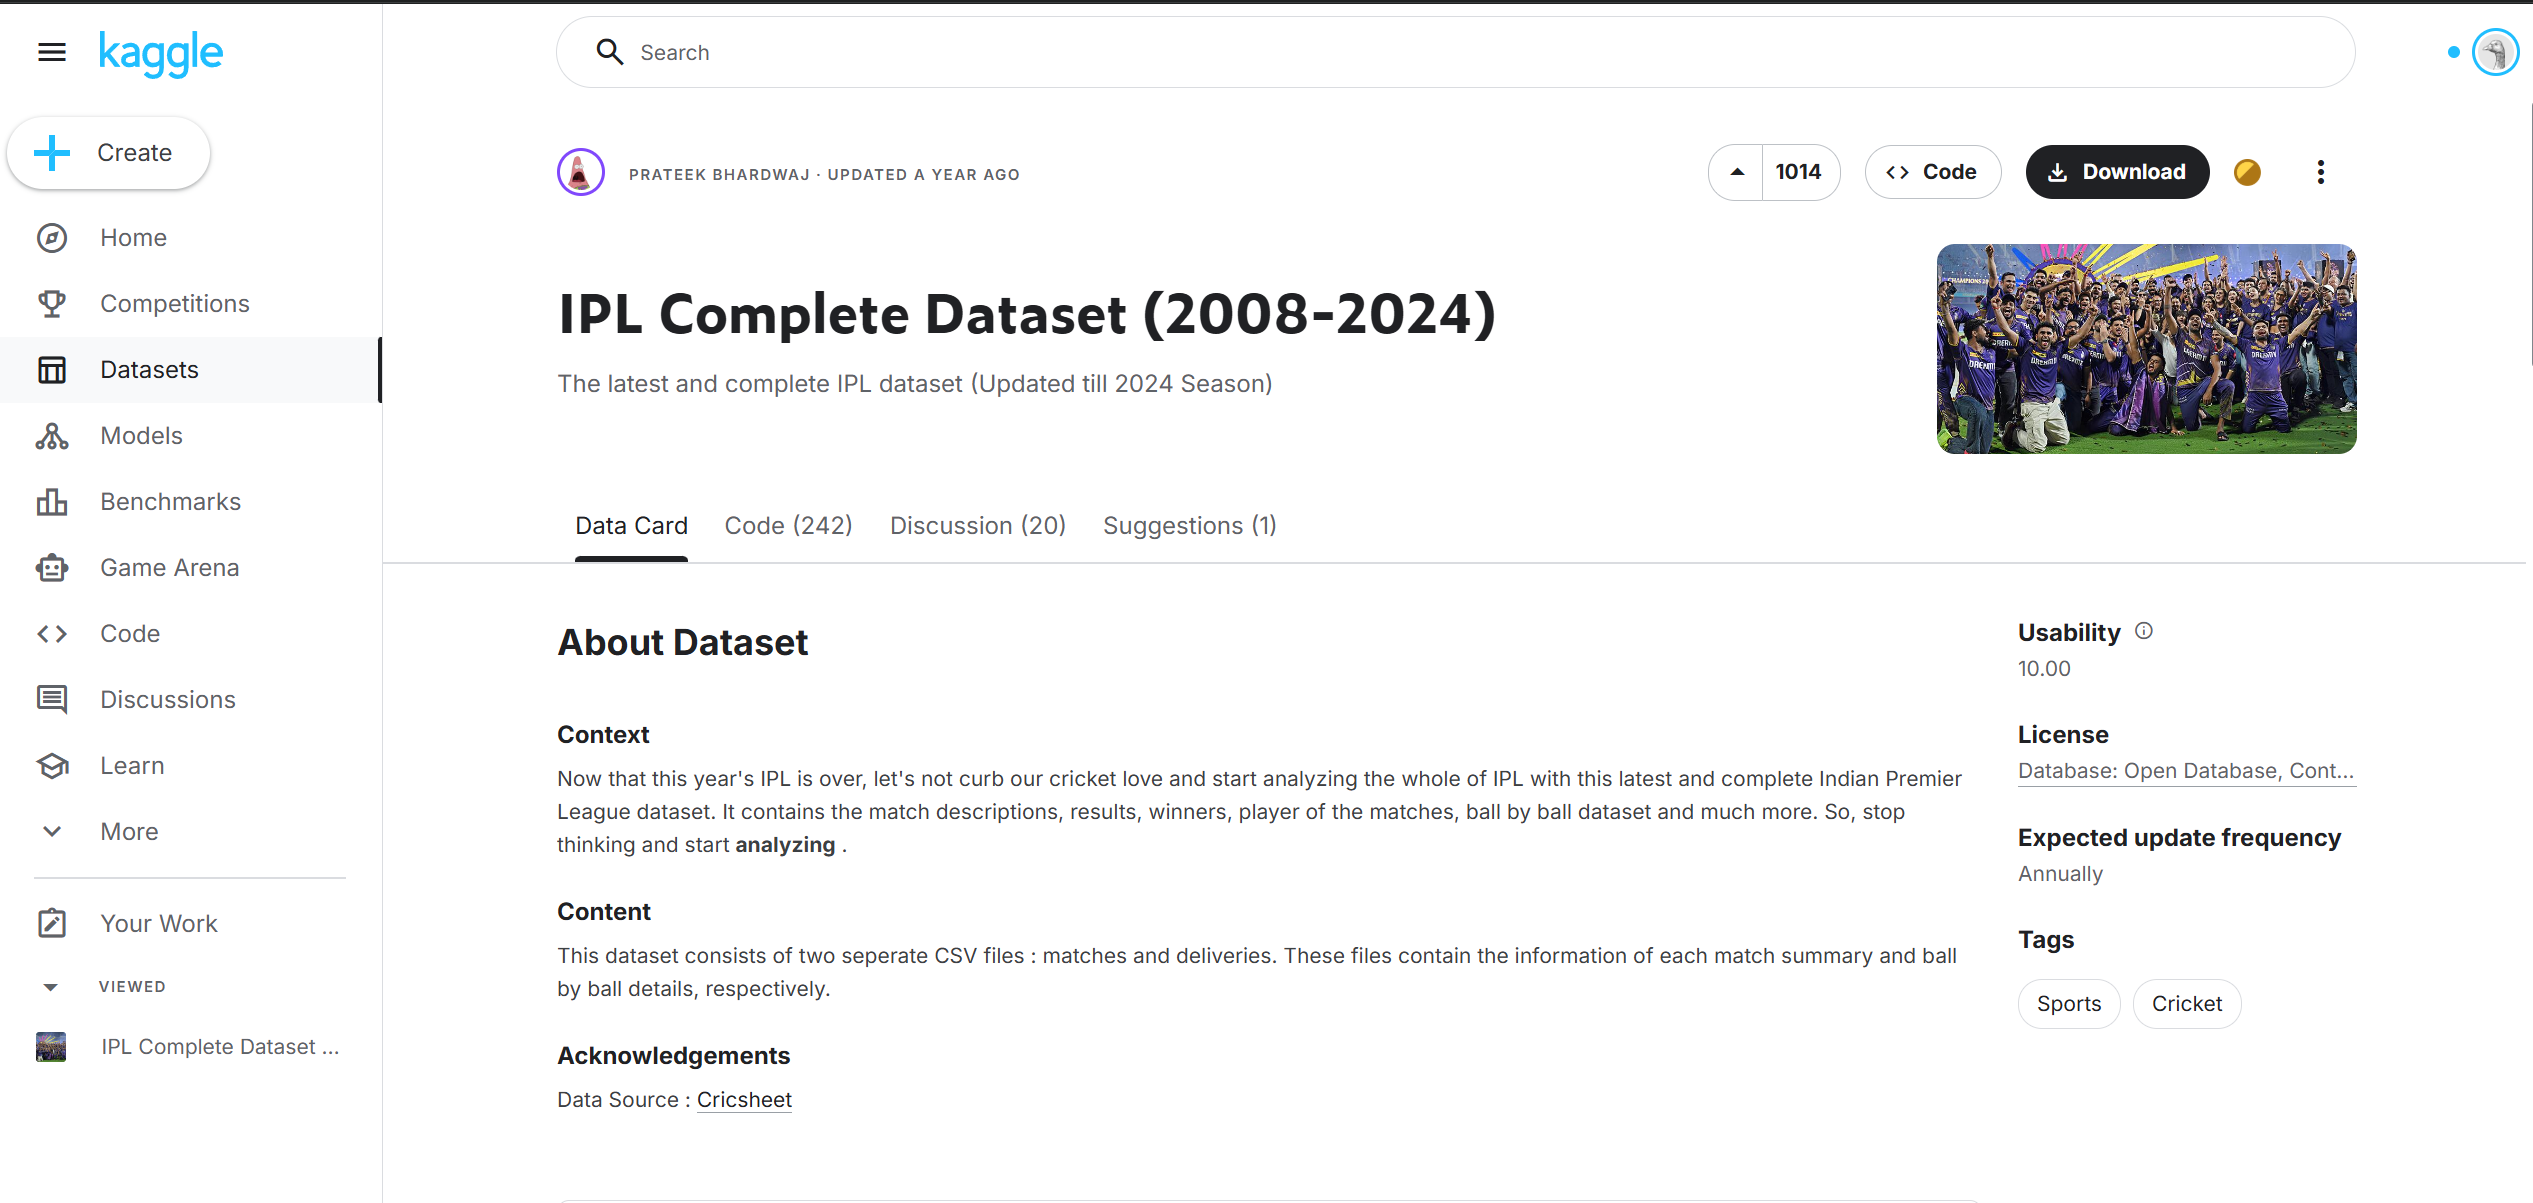
The Indian Premier League (IPL) is a massive, data-rich entity. Stakeholders like franchise owners and fantasy league PMs are all 'users' who need to make high-stakes, data-driven decisions.
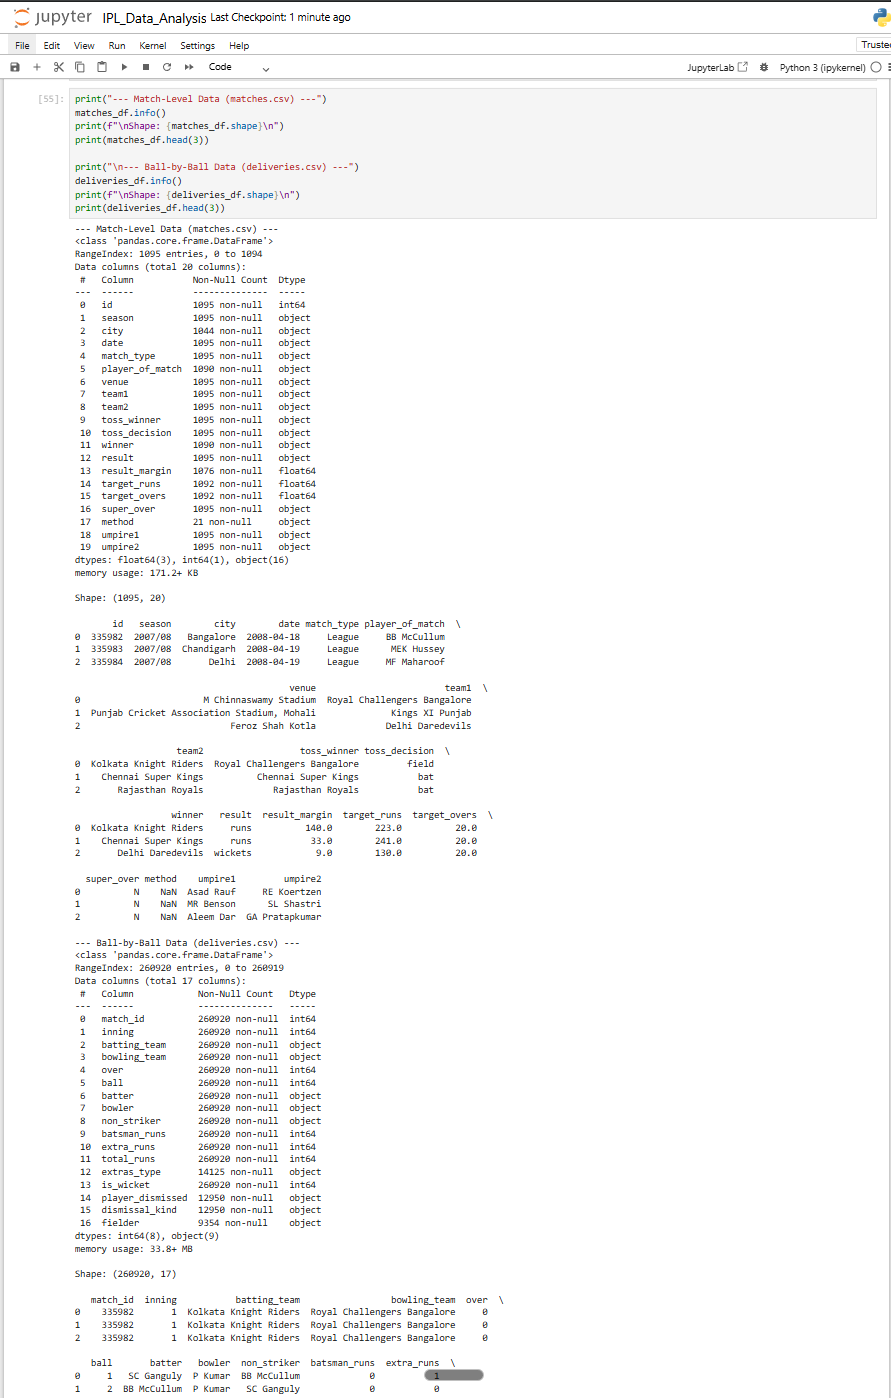
As a Product Manager, I can't build a strategy on flawed data. My first step was to perform a deep inspection of the raw dataset to assess its reliability.
As you can see in the inspection report on the left, the 'data product' was broken. The .info() command revealed critical errors:
Missing Data:
Columns like city and winner were missing hundreds of values (you can see the non-null count is lower than the total entries).
Wrong Data Types:
The date column was an object (text), not a real date. This makes time-series analysis impossible.
Before any insights could be trusted, I had to perform Data Engineering to fix these foundational flaws and build a reliable product.
The 'How': Engineering a Trusted Data Product
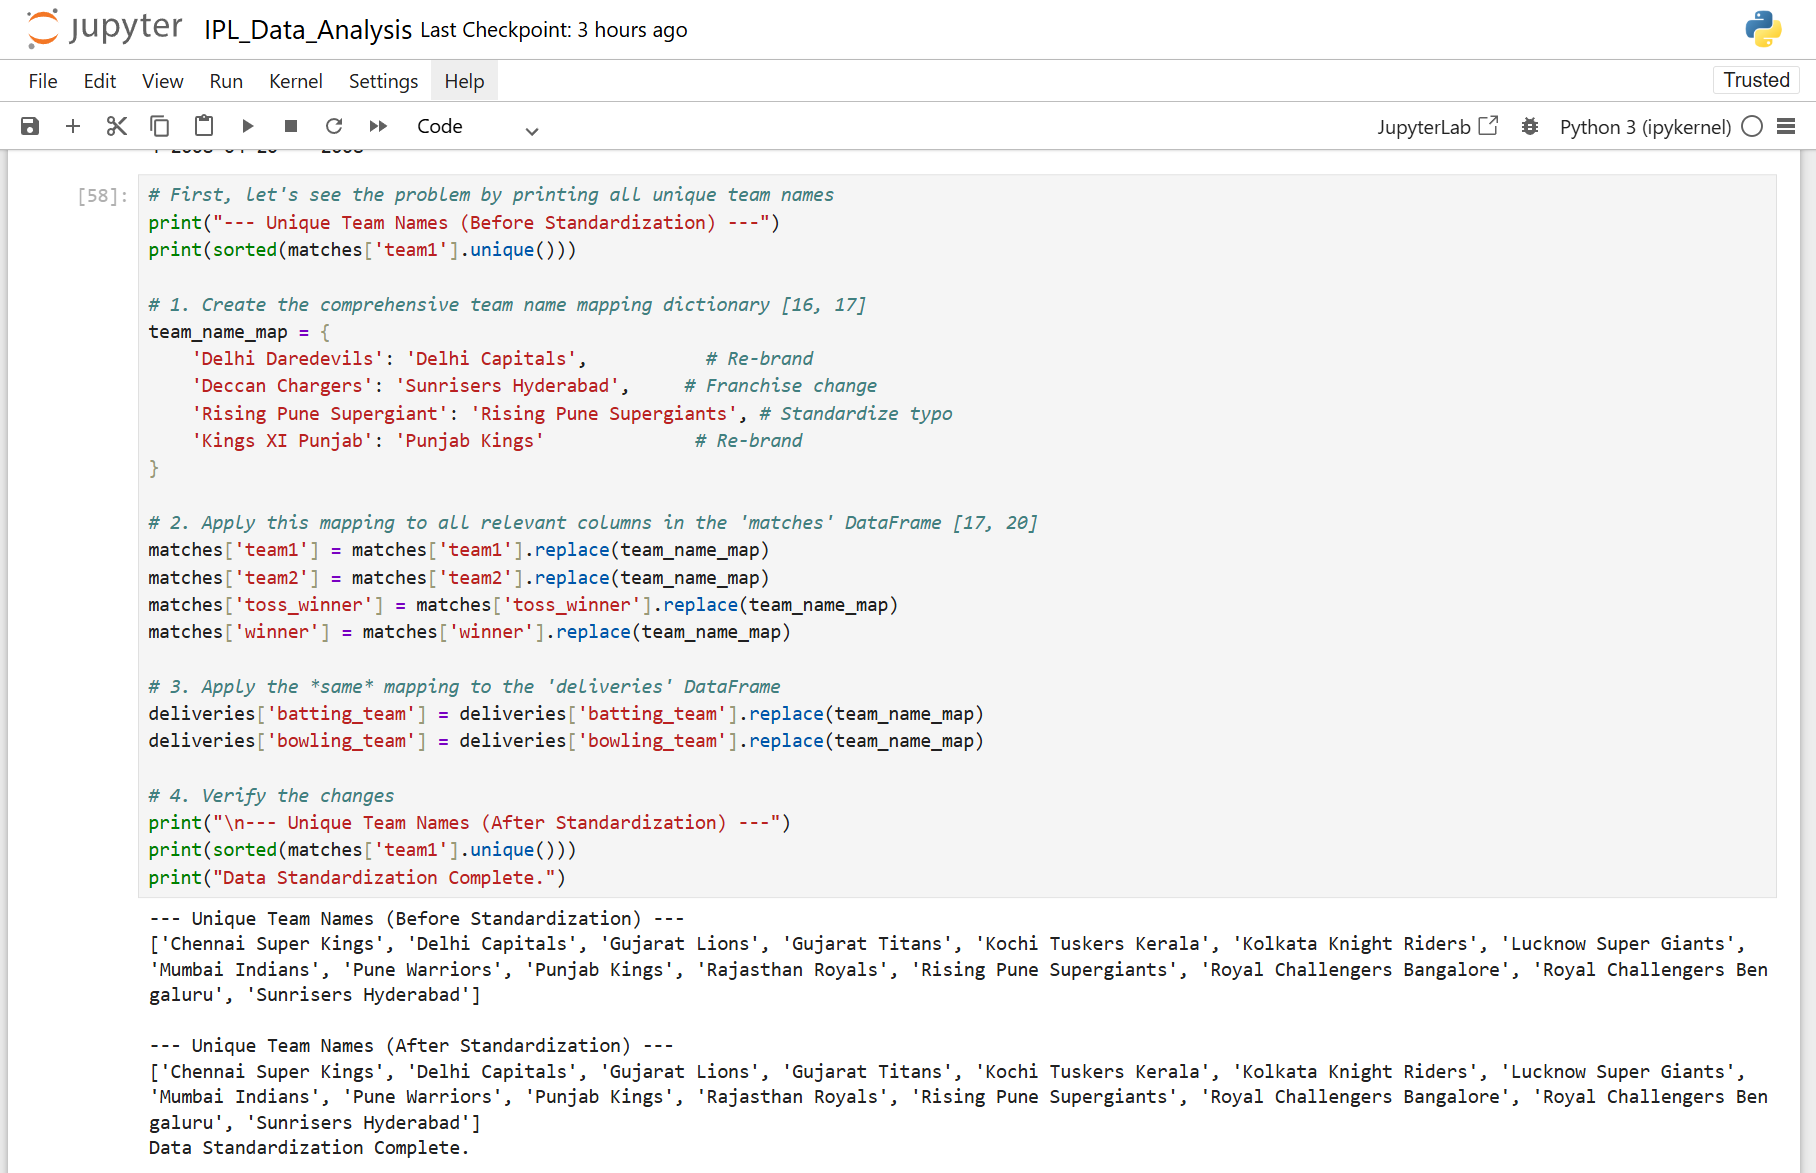
The raw dataset had a critical integrity flaw: Inconsistent Business Logic.
Over 13 years, IPL franchises re-branded (e.g., 'Delhi Daredevils' became 'Delhi Capitals'). The raw data treated these as completely different teams. Any analysis of 'most wins' or 'win rates' would have been factually incorrect.
My Solution: I engineered a standardization logic (using a Python mapping dictionary) to merge these historical entities. This transformed fragmented rows into a single source of truth, ensuring all downstream insights were accurate and reliable.
The 'Proof': SQL & Technical Independence
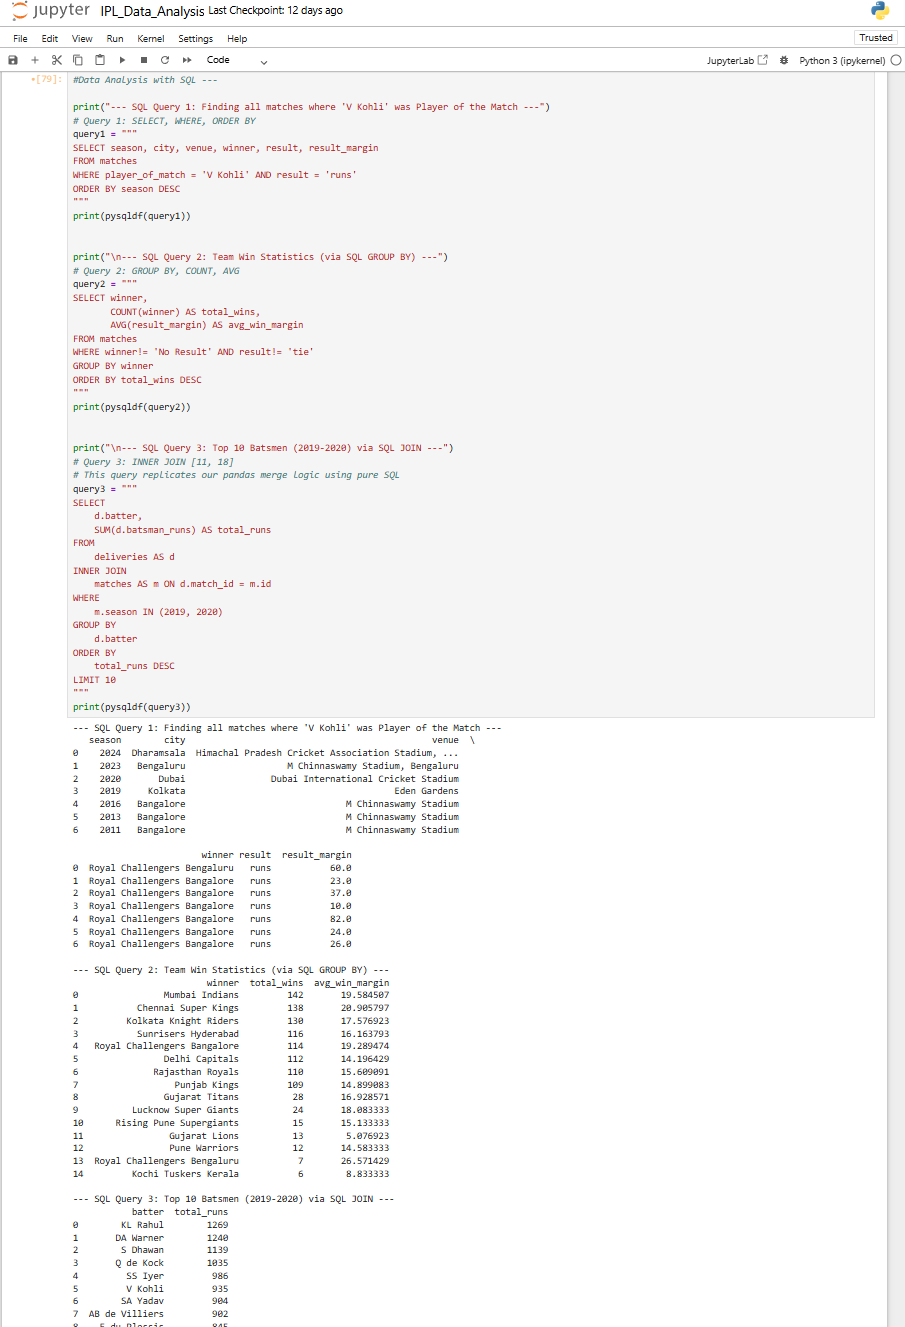
A strong Product Manager shouldn't be blocked by data access. While I used Python for the heavy lifting, I effectively used SQL to validate my findings and explore the data independently.
This section demonstrates three critical technical competencies:
Complex Joins (INNER JOIN): Raw data is often siloed. To analyze player performance by season, I programmatically merged two distinct datasets: the granular ball-by-ball data (deliveries) and the match metadata (matches).
Aggregation Logic (GROUP BY): I didn't just look at rows; I defined metrics. The code demonstrates aggregating thousands of rows to calculate high-level KPIs like 'Total Team Wins' and 'Average Margins'.
Data Validation (QA): I used SQL as a 'sanity check'. By deriving the same insights using two different languages, I ensured the final product metrics were 100% accurate.
The 'What': Shipping Actionable Insights
Clean data and SQL queries are just the means to an end. The goal of a Product Manager is to deliver insights that drive strategy.
I used Plotly to build interactive dashboard components that answer specific user questions:
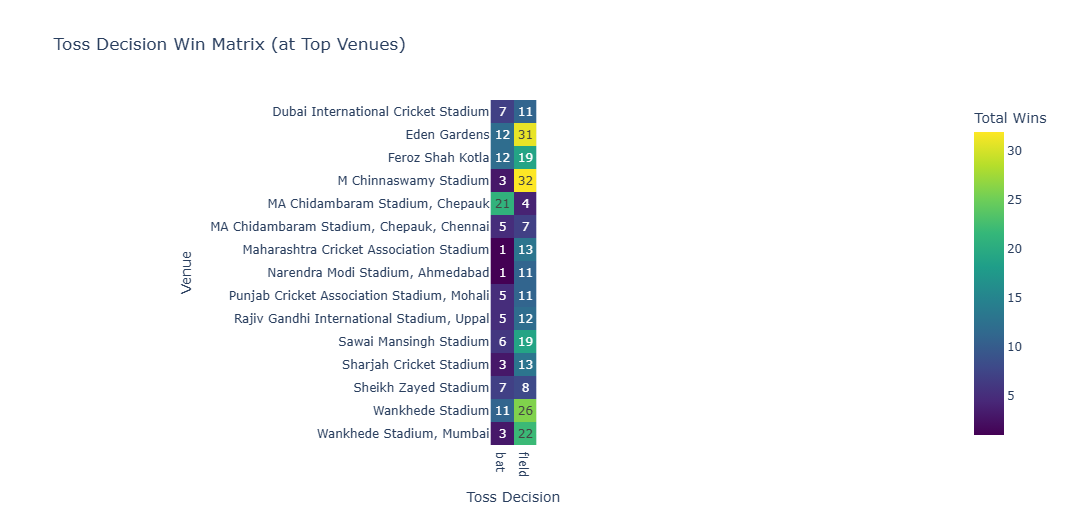
The Myth:
'Winning the toss guarantees a win.'
The Data Truth:
My analysis revealed a mere 50.5% correlation league-wide.
The Strategic Pivot:
The heatmap revealed that the 'Chase' advantage is highly venue-dependent (e.g., massive advantage at Wankhede, neutral at Chennai). This transforms a generic hunch into a venue-specific game plan.
Key PM Takeaways
Treat Data as a Product Asset: Algorithms are useless if the foundation is broken. By engineering the fix for historical team re-branding, I ensured that every strategic decision we made was built on truth, not just noise.
Don't Wait for Permission: I refuse to be blocked by technical barriers. I switch seamlessly between Python for heavy lifting and SQL for quick validation. This independence lets me answer high-stakes questions without waiting on engineering resources.
Ship Outcomes, Not Just Outputs: I didn't set out to just "build a dashboard." I set out to solve a specific user problem: "Does the toss actually matter?" I transformed raw stats into a clear, venue-specific game plan that gives users a competitive edge.